Use the Budget vs Actual page to compare estimated AFE amounts against actual costs. This view helps you monitor whether work is tracking above, below, or in line with budget by summarizing values by AFE and well.
Budget vs Actual is useful when you want to quickly answer questions like:
- Which AFEs are over budget?
- Which wells have the largest difference between estimate and actuals?
- Are totals changing when I switch between Net and Gross?
- Which transaction lines make up a summary amount?
- Which report setup should be saved as a view or dashboard widget?
When to use this page
Use Budget vs Actual when you want to review AFE-level budget performance across properties, fields, and reporting periods.
This page is especially helpful for:
- Reviewing current spending against AFE estimates
- Comparing estimate, actual, and difference totals
- Filtering results by property or field
- Saving a reusable Budget vs Actual view
- Creating dashboard widgets from a Budget vs Actual setup
- Drilling into transaction-level detail behind a number
Before you start
Budget vs Actual depends on imported LOS data and AFE-related values. If the page is blank or does not show the expected numbers, first confirm that the relevant data has been imported and that your filters are set correctly.
Check:
- Property selection
- Field selection
- Start and end month
- Net or Gross mode
- Whether the expected AFE data exists in the imported file
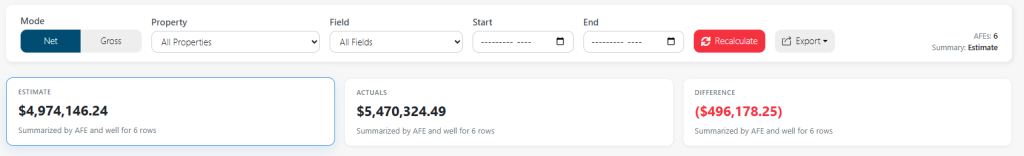
Filters and controls
The top toolbar controls what data appears in the Budget vs Actual table.
Mode
Use Net or Gross to choose how values should be displayed.
- Net shows values after net ownership or net reporting logic has been applied.
- Gross shows total gross values before net adjustments.
Switching modes recalculates the values shown in the table.
Property
Use the Property filter to limit the report to one property or multiple properties.
If multi-select is available, choose multiple properties to combine them in the same Budget vs Actual view.
Use the back/minus icon to return from multi-select mode to single-select mode.
Field
Use the Field filter to limit the report to one field or multiple fields.
This works similarly to the Property filter. Use multi-select when you want to compare or combine several fields in one report.
Start and End
Use Start and End to set the month range for the report.
The table recalculates based on the selected reporting period. If expected values are missing, confirm that the correct months are selected.
Summary cards
The summary cards near the top of the page show high-level totals for the current Budget vs Actual view.
Each card represents a section of the report, such as estimates, actuals, or differences. Click a card to switch the active summary section displayed in the table.
The table below the cards updates to show the selected section.
Budget vs Actual table
The main table summarizes values by AFE and well.
Use this table to review:
- AFE-level totals
- Well-level totals
- Estimated amounts
- Actual amounts
- Differences between estimate and actual
- Status or review indicators, if available
Positive and negative differences may be visually styled to make favorable or unfavorable variances easier to identify.
Edit Columns modal
Click Edit Columns to choose which columns appear in the summary table.
Use this modal when you want to simplify the view, hide columns you do not need, or focus the table on the most important values for your review.
To edit columns:
- Click Edit Columns.
- Turn columns on or off.
- Click Save to apply your changes.
Click Cancel to close the modal without saving changes.
Column preferences apply to the current Budget vs Actual view.
Export
Use Export to download the current Budget vs Actual view.
Available export options may include:
- Excel
- CSV
- PDF, if enabled
The export uses the current filters and visible data from the report. Before exporting, confirm that the mode, property, field, and month range are correct.
Save View
Click Save View when you want to reuse the current Budget vs Actual setup later.
A saved view preserves the report configuration, including the filters and report setup, so you can return to the same view without rebuilding it manually.
When saving a view, enter a clear name that describes the purpose of the view.
Examples:
- Monthly BvA Review
- West Field AFE Review
- 2026 Capital Budget Tracking
- Active AFEs – Net View
Save Widget
Click Save Widget when you want to add the current Budget vs Actual setup to a dashboard.
A widget gives users a dashboard-level snapshot of the report without requiring them to open and configure the Budget vs Actual page each time.
When saving a widget, you may be asked for:
- Saved definition name
- Widget display name
- Visibility
- Dashboard selection
Use a short display name that will make sense on a dashboard.
Save Chart Widget
Click Save Chart Widget when you want the current Budget vs Actual setup represented as a chart on a dashboard.
Use chart widgets when the trend, comparison, or visual summary is more useful than a table.
For example, a chart widget may be helpful when leadership needs to quickly see which AFEs have the largest variance.
Visibility options
When saving a view or widget, you may see visibility options.
Common visibility choices include:
Private
Only you can see and use the saved item.
Use this for personal working views.
Org
The saved item is available more broadly across the organization.
Use this for views or widgets that should be shared with the company.
Shared
The saved item can be shared with selected users or groups, depending on how sharing is configured.
Use this when only certain people need access.
Role
The saved item is available to users in a selected role.
Use this when a dashboard widget or saved view is relevant to a role such as executives, accounting, operations, or asset managers.
Transaction Drilldown modal
Some Budget vs Actual values can be opened in a Transaction Drilldown modal.
Use the drilldown modal to see the transaction lines behind a summary amount.
The modal may show details such as:
- AFE
- View or section
- Number of lines
- Total amount
- Transaction ID
- Date
- Vendor
- Invoice number
- Category
- Amount
- Source job
- Source file
- Link to the original record, if available
This is useful when a summary value looks unexpected and you need to see the underlying transactions.
If the drilldown is limited to the first set of matching lines, narrow your filters or use an export to review a larger set of records.
Status buttons
Some rows may include a status indicator or status button.
Use statuses to track whether a Budget vs Actual item has been reviewed, is still open, or has been closed.
If your organization uses status tracking, keep statuses updated so other users know which items still need attention.
Common workflows
Review budget performance for a field
- Choose Net or Gross.
- Select the desired field.
- Set the start and end months.
- Click Recalculate.
- Review the summary cards.
- Open the section with the most relevant totals.
- Drill into any unexpected values.
Create a reusable monthly view
- Set the mode, property, field, and month range.
- Confirm the table shows the right data.
- Click Save View.
- Enter a clear view name.
- Choose the correct visibility.
- Save the view.
Add Budget vs Actual to a dashboard
- Configure the Budget vs Actual page with the desired filters.
- Click Save Widget or Save Chart Widget.
- Enter a saved definition name.
- Enter a dashboard display name.
- Choose the visibility.
- Select the dashboard.
- Save the widget.
Investigate an unexpected variance
- Find the AFE or well with the unexpected value.
- Open the relevant summary section.
- Click into the value if drilldown is available.
- Review the transaction lines.
- Check vendor, invoice, category, source file, and amount.
- Export if you need to review the data outside Upstream+.
Troubleshooting
The table is blank
Check the selected property, field, date range, and Net/Gross mode. Also confirm that relevant LOS data has been imported.
Expected AFEs are missing
Confirm that the uploaded data includes AFE values and that your filters do not exclude them.
The totals look wrong
Check the mode, date range, selected property, selected field, and whether the data was recently imported or overwritten.
I do not see the dashboard I want
You may not have access to that dashboard, or it may not exist yet. Create or request access to the dashboard before saving the widget.
My saved widget does not show what I expected
Return to Budget vs Actual, recreate the exact filters you want, and save the widget again with a clear name.
The drilldown does not show all rows
The drilldown may limit the number of transaction lines displayed. Narrow the filters or use an export to review more detail.


")


