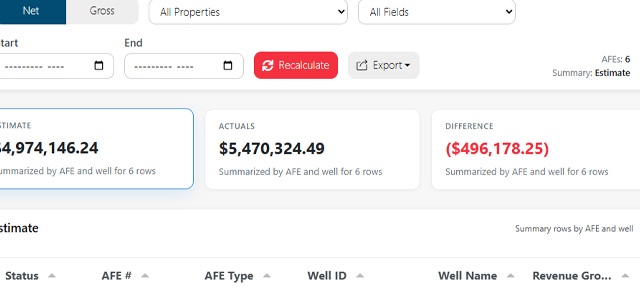
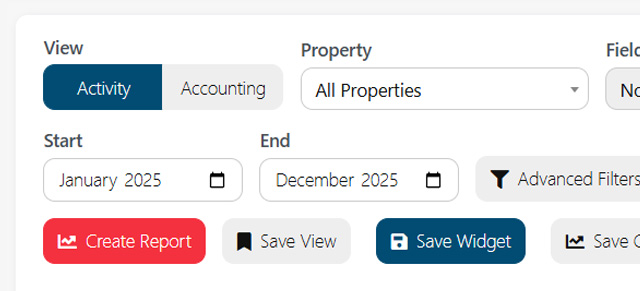
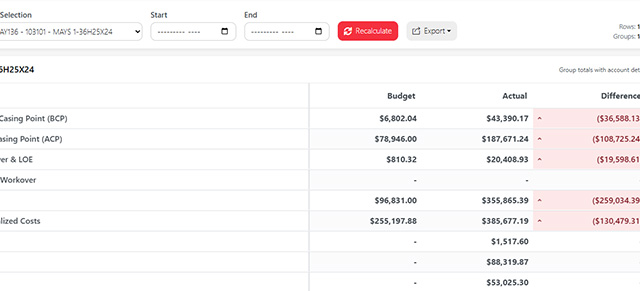
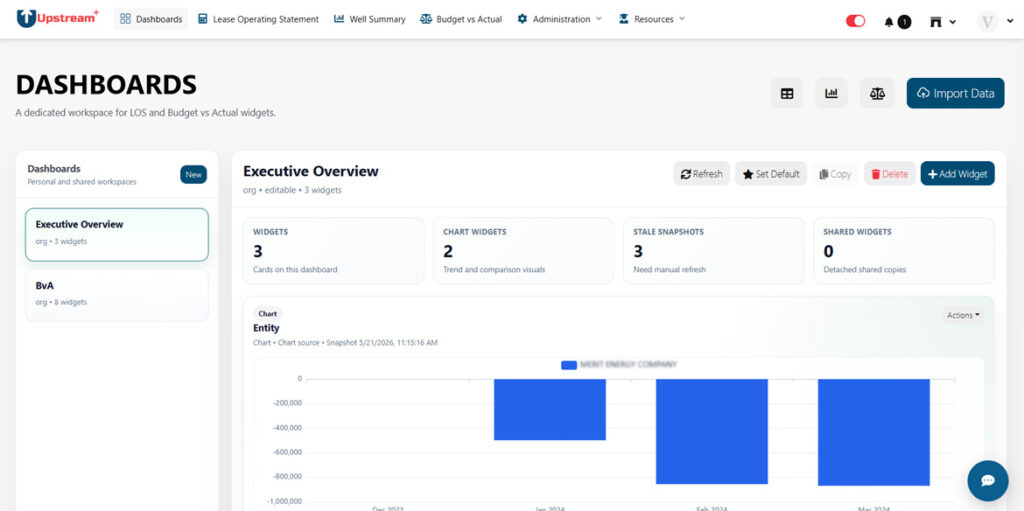
Dashboards help you turn saved report views into a working command center. Instead of rebuilding the same reports each time, you can save important views as widgets and organize them into dashboards for recurring review.
When to use this page
Use Dashboards when you want to:
- Review key Upstream+ metrics in one place
- Monitor saved LOS, Budget vs Actual, or Well Summary views
- Create dashboards for different teams or roles
- Add widgets from saved report definitions
- Rearrange widgets into a useful layout
- Share dashboard views with other users
- Track high-priority operating or financial indicators
Dashboards are most useful for reports that will be reviewed repeatedly.
Before you start
Dashboards depend on saved views, saved widgets, imported data, and user permissions.
Before building a dashboard, make sure:
- LOS data has been imported
- The report view you want has been configured
- Any needed widgets have been saved from their source report
- You have access to the dashboard you want to edit
- Visibility settings are correct for the intended audience
If a widget does not show expected data, return to the source report and confirm the saved definition.
Dashboard list (left side)
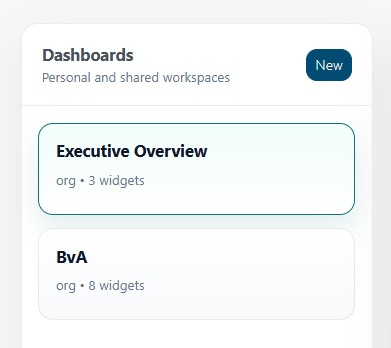
The dashboard list shows dashboards available to you.
Select a dashboard to open it. The active dashboard displays its widgets, summary cards, and available actions.
Depending on your permissions, you may be able to create, rename, delete, or rearrange dashboards.
Dashboard stage (right side)

The dashboard stage is the main workspace where widgets appear.
Use this area to review saved report widgets, charts, summaries, and key metrics.
A dashboard may include widgets from different Upstream+ areas, such as:
- LOS Statement
- Budget vs Actual
- Budget vs Actual Detail
- Well Summary Report
- Saved chart widgets
- Saved summary widgets
The exact widgets available depend on what has been saved and shared in your organization.
Create Dashboard
Use Create Dashboard when you want to build a new dashboard for a specific purpose.
Examples:
- Executive Overview
- Monthly Operating Review
- Budget vs Actual Review
- Field Performance Dashboard
- Accounting Review
- Asset Manager Dashboard
When creating a dashboard, use a clear name that tells users what the dashboard is for.
A good dashboard name should answer: “Who uses this, and what are they reviewing?”
Rename or edit a dashboard
Use the dashboard edit or rename option when the dashboard’s purpose has changed or the name needs to be clearer.
Rename dashboards carefully so users can still recognize what they are opening.
Good examples:
- “Monthly BvA Review”
- “North Region Operating Summary”
- “Executive KPI Dashboard”
- “Q3 AFE Monitoring”
Avoid vague names such as “Dashboard 1” or “Test.”
Delete dashboard confirmation
If you delete a dashboard, the dashboard layout may be removed from the dashboard list.
Before deleting, confirm:
- The dashboard is no longer needed
- Other users do not rely on it
- Important widgets are saved elsewhere
- You are deleting the dashboard, not just removing one widget
If you are unsure, rename the dashboard or remove individual widgets instead of deleting the entire dashboard.
Add Widget
Use Add Widget to place a saved report, chart, or metric onto the current dashboard.
Widgets usually come from saved report definitions created elsewhere in Upstream+, such as Budget vs Actual or Budget vs Actual Detail.
To add a widget:
- Open the dashboard.
- Click Add Widget.
- Choose the saved widget or report definition.
- Confirm the widget settings.
- Add it to the dashboard.
- Review the dashboard layout.
If the widget you need is missing, return to the source report and use Save Widget or Save Chart Widget first.
Widget drawer or widget picker
The widget drawer or picker shows available widgets that can be added to the dashboard.
Use it to browse saved definitions and choose the widget that fits the dashboard.
When selecting a widget, review:
- Widget name
- Source report
- Visibility
- Owner or creator, if shown
- Whether it is a table, chart, or summary widget
- Whether it belongs on the selected dashboard
Only add widgets that support the dashboard’s purpose.
Widget layout
Dashboard widgets can be arranged to make the dashboard easier to read. Depending on the layout options available, widgets may appear in different sizes such as standard, wide, or full-width.
Use larger layouts for widgets that need more space, such as tables or detailed charts. Use smaller layouts for compact summary metrics.
Recommended layout order:
- Most important summary metrics at the top
- High-level charts or trends next
- Detail tables below
- Supporting or secondary widgets last
Reorder widgets
If drag-and-drop is available, use it to reorder widgets on the dashboard.
Reordering helps you place the most important information where users will see it first.
A good dashboard should read from top to bottom:
- What is happening?
- What changed?
- What needs attention?
- What details support the summary?
After reordering widgets, confirm that the dashboard still tells a clear story.
Widget actions menu
Each widget may have its own actions menu.
Common widget actions may include:
- View details
- Edit widget settings
- Rename widget
- Resize widget
- Refresh widget
- Remove widget from dashboard
- Open source report
- Delete saved definition, if permitted
Use widget actions carefully. Removing a widget from a dashboard may not delete the saved report definition, but deleting the saved definition may affect other dashboards or users.
Refreshing dashboard data
Dashboard widgets are based on saved report definitions and imported data.
If the dashboard does not show current values:
- Confirm the latest LOS data has been imported.
- Refresh the dashboard or widget.
- Open the source report.
- Confirm the saved filters are correct.
- Re-save the widget if the definition needs to change.
A dashboard widget can only display what its saved definition is configured to show.
Widget visibility
Widgets and dashboards may have visibility settings that control who can see or use them.
Common visibility options include:
Private
Only you can access the saved item. Use this for personal dashboards or drafts.
Org
The saved item is available across the organization. Use this for shared dashboards intended for broad access.
Shared
The saved item can be shared with selected users or groups. Use this when a dashboard is relevant to a smaller team.
Role
The saved item is available to users assigned to a specific role. Use this for dashboards tailored to executives, accounting, operations, asset managers, or other defined roles.
Starter or shared widgets
Some dashboards may include starter widgets or shared widgets. Starter widgets can help users begin with a useful default layout.
Shared widgets allow teams to work from the same report definitions instead of creating duplicate versions. Before changing a shared widget, consider whether other users rely on it.
Common workflows
Create a new dashboard
- Open Dashboards.
- Click Create Dashboard.
- Enter a clear dashboard name.
- Save the dashboard.
- Add widgets.
- Arrange the layout.
- Review the dashboard for clarity.
Add Budget vs Actual to a dashboard
- Open Budget vs Actual.
- Configure the report filters.
- Click Save Widget or Save Chart Widget.
- Select the dashboard.
- Save the widget.
- Return to Dashboards.
- Confirm the widget appears correctly.
Add Budget vs Actual Detail to a dashboard
- Open Budget vs Actual Detail.
- Select the AFE and filters.
- Click Save Widget.
- Choose the dashboard.
- Save the widget.
- Open Dashboards and review the widget.
Reorganize a dashboard
- Open the dashboard.
- Identify the most important widgets.
- Move those widgets to the top.
- Group related widgets together.
- Resize widgets if available.
- Remove duplicate or unnecessary widgets.
- Review the final layout.
Remove a widget from a dashboard
- Open the widget actions menu.
- Choose the remove option.
- Confirm the action if prompted.
- Review the dashboard layout.
Removing a widget from a dashboard does not always delete the saved definition. If you need to permanently delete the saved definition, use the appropriate delete action only when you are sure it is no longer needed.
Troubleshooting
I do not see a dashboard
You may not have access to it, or it may not have been shared with you. Ask the dashboard owner or an administrator to confirm visibility.
I do not see the widget I want to add
The widget may not have been saved yet, or it may not be shared with you. Return to the source report and save the widget, or ask the owner to adjust visibility.
A widget shows old data
Confirm the latest data has been imported, then refresh the dashboard or open the source report to verify the saved filters.
A widget is blank
Check whether the saved report definition has filters that exclude the current data. Open the source report and confirm the configuration.
A dashboard is too crowded
Remove unnecessary widgets, resize large widgets, and move the most important information to the top.
I accidentally removed a widget
If the saved definition still exists, add the widget back to the dashboard. If the saved definition was deleted, recreate it from the source report.
A shared dashboard changed unexpectedly
Another user with access may have edited the dashboard. Review permissions and visibility if multiple users maintain the same dashboard.