Use the Budget vs Actual Detail page to review the account-level detail behind a selected AFE. While the Budget vs Actual summary page helps you compare AFEs at a higher level, this detail page lets you inspect the grouped budget and actual values that make up a specific AFE.
This page is useful when you need to understand why an AFE is over budget, under budget, missing activity, or showing an unexpected variance.
When to use this page
Use Budget vs Actual Detail when you want to:
- Review one AFE in more detail
- Compare budget and actual amounts by account group
- Investigate differences between estimated and actual costs
- See which categories or accounts are driving a variance
- Drill into transaction lines behind actual amounts
- Save a detailed AFE view for later
- Add a Budget vs Actual detail widget to a dashboard
Before you start
Budget vs Actual Detail depends on imported LOS data and AFE information. If the page does not show the expected data, confirm that the relevant data has been imported and that the selected AFE exists in the uploaded data.
Check:
- The selected AFE
- Net or Gross mode
- Start and end month
- Property and field filters carried over from the summary page
- Whether empty rows are hidden
- Whether the expected data was included in the most recent import
Filters and controls
The toolbar at the top of the page controls which detail data appears in the table.

Mode
Use Net or Gross to choose how values are displayed.
- Net shows values after net ownership or net reporting logic has been applied.
- Gross shows total gross values before net adjustments.
Switching modes reloads the detail table using the selected mode.
AFE Selection
Use AFE Selection to choose the AFE you want to review.
The page updates the detail table based on the selected AFE. If the AFE you need is not listed, confirm that the data has been imported and that the AFE is included in the source file.
Start and End
Use Start and End to set the month range for the detail report.
The selected range determines which budget and actual values appear in the table. If values appear to be missing, confirm that the start and end months cover the period you expect.
Show empty rows?
Use Show empty rows? to control whether rows with no budget or actual values are displayed.
When this option is turned off, rows where both Budget and Actual are empty are hidden. This makes the table easier to review when you only want to see active or relevant lines.
Turn this option on when you want to inspect the full account structure, including rows with no values.
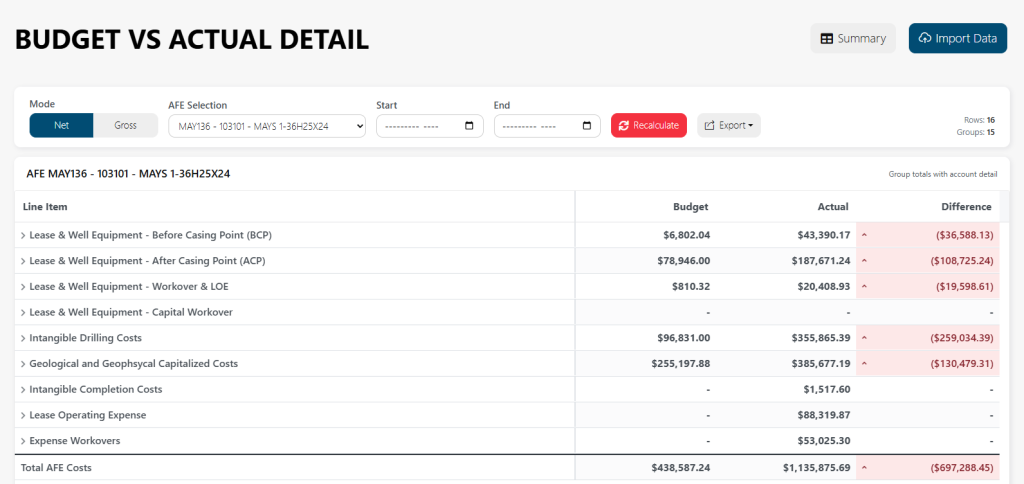
Detail table
The main table shows grouped Budget vs Actual detail for the selected AFE.
Use this table to review:
- Account groups
- Account-level detail
- Budget values
- Actual values
- Differences between budget and actual
- Group totals
- Grand totals
Rows may be grouped so you can expand or collapse sections and review the level of detail you need.
Positive and negative differences may be highlighted to make variances easier to identify.
Reading the detail table
Start with the highest-level group totals, then expand into the sections that show the largest differences.
A typical review flow is:
- Confirm the selected AFE.
- Confirm the month range.
- Review the grand total.
- Look for the largest differences.
- Expand the related group.
- Review the account-level detail.
- Drill into transaction lines when available.
This keeps the review focused on the categories most likely to explain the variance.
Export
Use Export to download the current detail view.
Available export options may include:
- Excel
- CSV
The export uses the current AFE, mode, date range, and table data. Before exporting, confirm that the selected filters are correct.
Save View
Click Save View when you want to save the current Budget vs Actual Detail setup for later.
A saved view lets you return to the same AFE detail configuration without rebuilding it manually.
When saving a view, use a clear name that describes the purpose.
Examples:
- AFE 1042 Detail Review
- Q2 Compressor AFE Detail
- West Field BvA Detail
- Monthly AFE Variance Review
Save Widget
Click Save Widget when you want to add the current Budget vs Actual Detail setup to a dashboard.
This is helpful when a specific AFE needs ongoing monitoring or when a team regularly reviews the same detail view.
When saving a widget, you may be asked for:
- Saved definition name
- Widget display name
- Visibility
- Dashboard selection
Use a short widget display name that will be easy to understand on the dashboard.
Visibility options
When saving a view or widget, choose who should be able to access it.
Private
Only you can see and use the saved item.
Use this for personal analysis or draft views.
Org
The saved item is available more broadly across the organization.
Use this for views that should be available company-wide.
Shared
The saved item can be shared with selected users or groups, depending on how sharing is configured.
Use this when only certain people need access.
Role
The saved item is available to users assigned to a selected role.
Use this when the detail view is relevant to a role such as accounting, operations, executives, or asset managers.
Transaction Drilldown modal
Some values in the Budget vs Actual Detail table can be opened in a Transaction Drilldown modal.
Use this modal to review the transaction lines behind a value.
The drilldown may include:
- AFE
- View or section
- Number of transaction lines
- Total amount
- Transaction ID
- Date
- Vendor
- Invoice number
- Category
- Amount
- Source job
- Source file
- Link to the original record, if available
This is useful when a number looks incorrect or needs explanation.
If the drilldown only shows the first set of matching lines, narrow the filters or export the data to review a larger set.
Common workflows
Review one AFE in detail
- Select the AFE.
- Choose Net or Gross.
- Set the start and end months.
- Click Recalculate.
- Review group totals.
- Expand sections with large differences.
- Drill into transaction lines as needed.
Investigate a variance
- Find the row with the unexpected difference.
- Review whether the variance is at the group or account level.
- Expand the group if needed.
- Open the transaction drilldown if available.
- Review vendor, invoice, category, source file, and amount.
- Export the detail if additional offline review is needed.
Save a reusable detail view
- Select the AFE and filters.
- Confirm the detail table shows the right data.
- Click Save View.
- Enter a clear view name.
- Choose the visibility.
- Save the view.
Add AFE detail to a dashboard
- Select the AFE and filters.
- Confirm the table shows the correct detail.
- Click Save Widget.
- Enter a saved definition name.
- Enter a widget display name.
- Select the dashboard.
- Choose the visibility.
- Save the widget.
Troubleshooting
The table is blank
Check the selected AFE, date range, and Net/Gross mode. Also confirm that relevant data has been imported.
The AFE I need is missing
Confirm that the AFE exists in the uploaded data and that the import completed successfully.
Expected rows are hidden
Turn on Show empty rows? if you need to see rows where both Budget and Actual are empty.
The totals look wrong
Check the selected mode, month range, and imported data. Also confirm that you are reviewing the correct AFE.
The widget does not show what I expected
Return to Budget vs Actual Detail, recreate the exact filters you want, and save the widget again with a clear name.
The drilldown does not show all transactions
The drilldown may limit the number of displayed lines. Narrow the filters or export the data for a broader review.
")

")


